
Mathematics
·
Why Ice Cream Is Making People Drown
Medium
6 min
Why Ice Cream Is Making People Drown
The sneaky mistake that fools scientists, journalists, and your brain every single day.
Share
Ice cream sales and drowning deaths rise and fall together almost perfectly. If you ran the numbers, you'd conclude ice cream is killing people. Researchers have found equally absurd patterns — like Nicolas Cage movies correlating with pool drownings. The data is real. The conclusion is insane. Here's why your brain keeps making this mistake anyway.
Correlation means two things move together. When one goes up, the other tends to go up (or down) too. That's it. It says nothing — zero, nothing — about whether one thing is causing the other. But your brain hates that. Your brain is a pattern-matching machine that evolved to find causes fast, because in the wild, hesitating to connect 'rustling grass' to 'predator' got you eaten. So the moment you see two things moving in sync, your brain whispers: one must be causing the other. It's almost always wrong.
Analogy
Think about a rough week. You're drinking more coffee, and you're sleeping worse. Correlation: real. But did the coffee wreck your sleep? Maybe. Or maybe a brutal deadline made you anxious, and the anxiety is driving both the extra coffee AND the bad sleep. The real cause — the stress — is invisible if all you look at is coffee and sleep. It's driving both things at once. That hidden driver has a name: a confounding variable. And it's the reason most 'X causes Y' headlines you read are quietly, confidently wrong.
Make your call
Back to the original mystery: ice cream sales and drowning deaths rise and fall together almost perfectly. What's actually causing both?
A
Ice cream contains something that impairs swimming judgment
B
Summer weather drives both — it's a hidden third variable
C
It's a coincidence with no real explanation
Back to the ice cream and drowning thing. Both spike in summer. Not because one causes the other — because summer causes both. More heat means more ice cream purchases AND more people swimming, which means more drowning risk. Summer is the confounding variable, hiding in plain sight. Once you see it, you can't unsee it. And once you start looking for hidden third variables in every 'surprising correlation' headline, you'll realize they're almost always there.
Key Insight
Correlation tells you two things are dancing together. Causation tells you one of them is leading. The data alone cannot tell you which is which. Ever. That requires an experiment — or very careful reasoning about what else might be pulling the strings.
Example
In the early 2000s, researchers noticed kids who had more books in their homes scored higher on reading tests. Headlines screamed: 'Books boost kids' reading!' Parents panic-bought libraries. But here's the thing — the books weren't teaching the kids to read. Families who valued education (and could afford books) also tended to read to their kids, send them to better schools, and engage with them more. The books were a symptom of an educational culture, not the cause of better reading. Buying books without changing anything else? Probably didn't move the needle. The correlation was real. The conclusion was wrong.
So how do you actually prove causation? The gold standard is a randomized controlled trial — you take two identical groups, expose one to the thing you're testing and not the other, and see what happens. Clinical drug trials work this way. You randomly assign people to get the drug or a placebo, so everything else is equal. If the drug group gets better at a higher rate, you've isolated the cause. The randomization kills the confounders. Without it, you're just watching two things dance and guessing who's leading.
And here's where it gets uncomfortable: most studies you'll read about in the news are not randomized controlled trials. They're observational — researchers watched what happened to a group of people and looked for patterns. That's useful! But it's correlation territory, not causation territory. 'Coffee drinkers have lower rates of depression' doesn't mean coffee cures depression. Maybe people who can afford daily coffee habits have more financial stability. Maybe they have more social routines. Maybe they just sleep better because of their overall lifestyle. The data can't tell you. Next time you see a health headline, ask: did they actually run an experiment, or did they just notice two things moving together?
Related threads
Mathematics
·
Why Your 'Average' Salary Is a Lie
Why Your 'Average' Salary Is a Lie
Sources
Images from Wikimedia Commons. Attribution required by license.
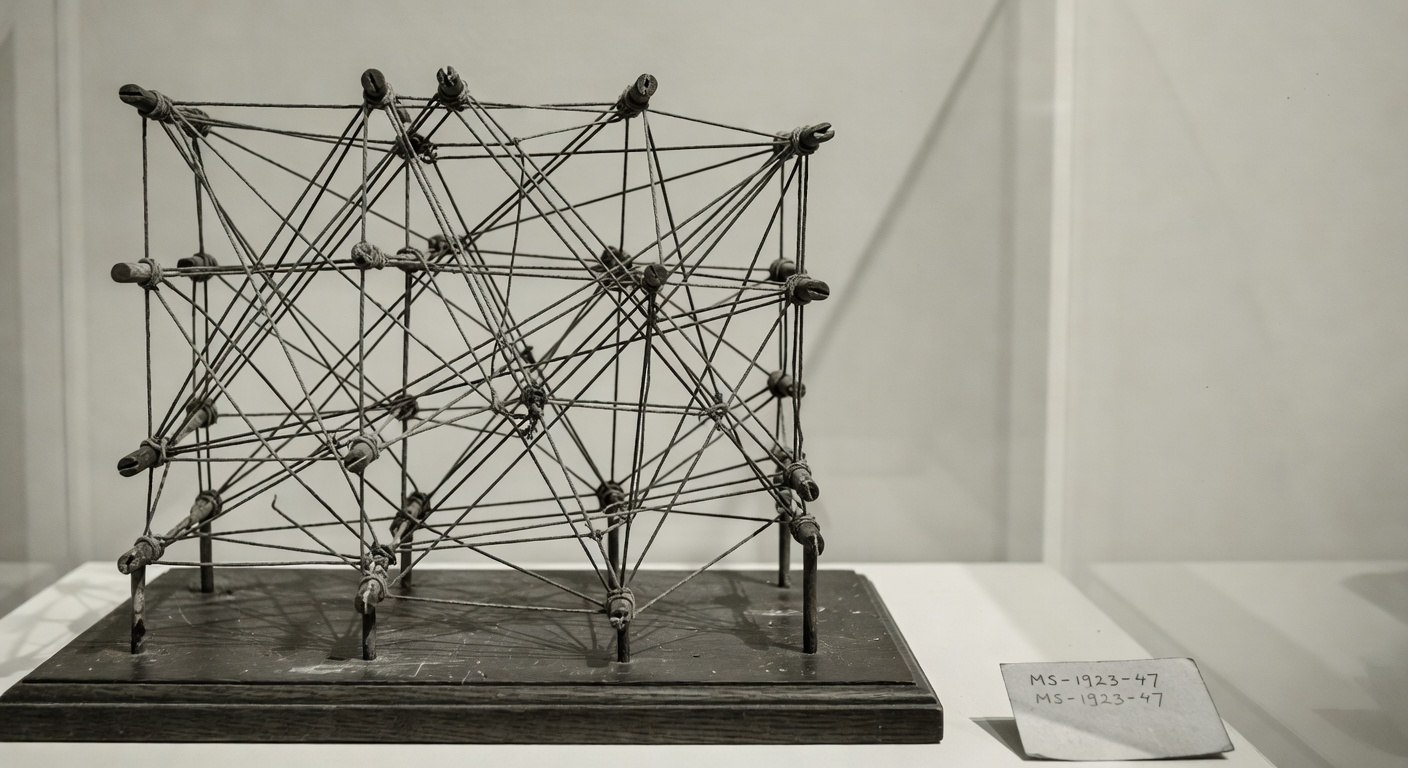
tangled string connections
Generated by Grok Imagine (xAI), prompt: Generate a single 16:9 horizontal image for an educational lesson.
Lesson title: "Why Ice Cream Is Making People Drown" · The sneaky mistake that fools scientists, journalists, and your brain every si…
Original map made by John Snow in 1854. Cholera cases are highlighted in black, showing the clusters of cholera cases (indicated by stacked rectangles) in the London epidemic of 1854. The map was created in order to better understand the pattern of cholera spread in the 1854 Broad Street cholera outbreak, which Snow would use as an example of how cholera spread via the fecal-oral route through water systems as opposed to the miasma theory of disease spread. The contaminated pump is located at the intersection of Broad Street and Cambridge Street (now Lexington Street), running into Little Windmill Street. The map marks an important part of the development of epidemiology as a field, and of disease mapping as a whole.
John Snow · Public domain
Madonna and Child — ca. 1480
Carlo Crivelli via The Metropolitan Museum of Art (Public Domain)
Quiz yourself