Geography
·
Every Map You've Ever Seen Is a Lie
Easy
5 min
Every Map You've Ever Seen Is a Lie
Why flattening a sphere forces every mapmaker to choose what to sacrifice.
Share
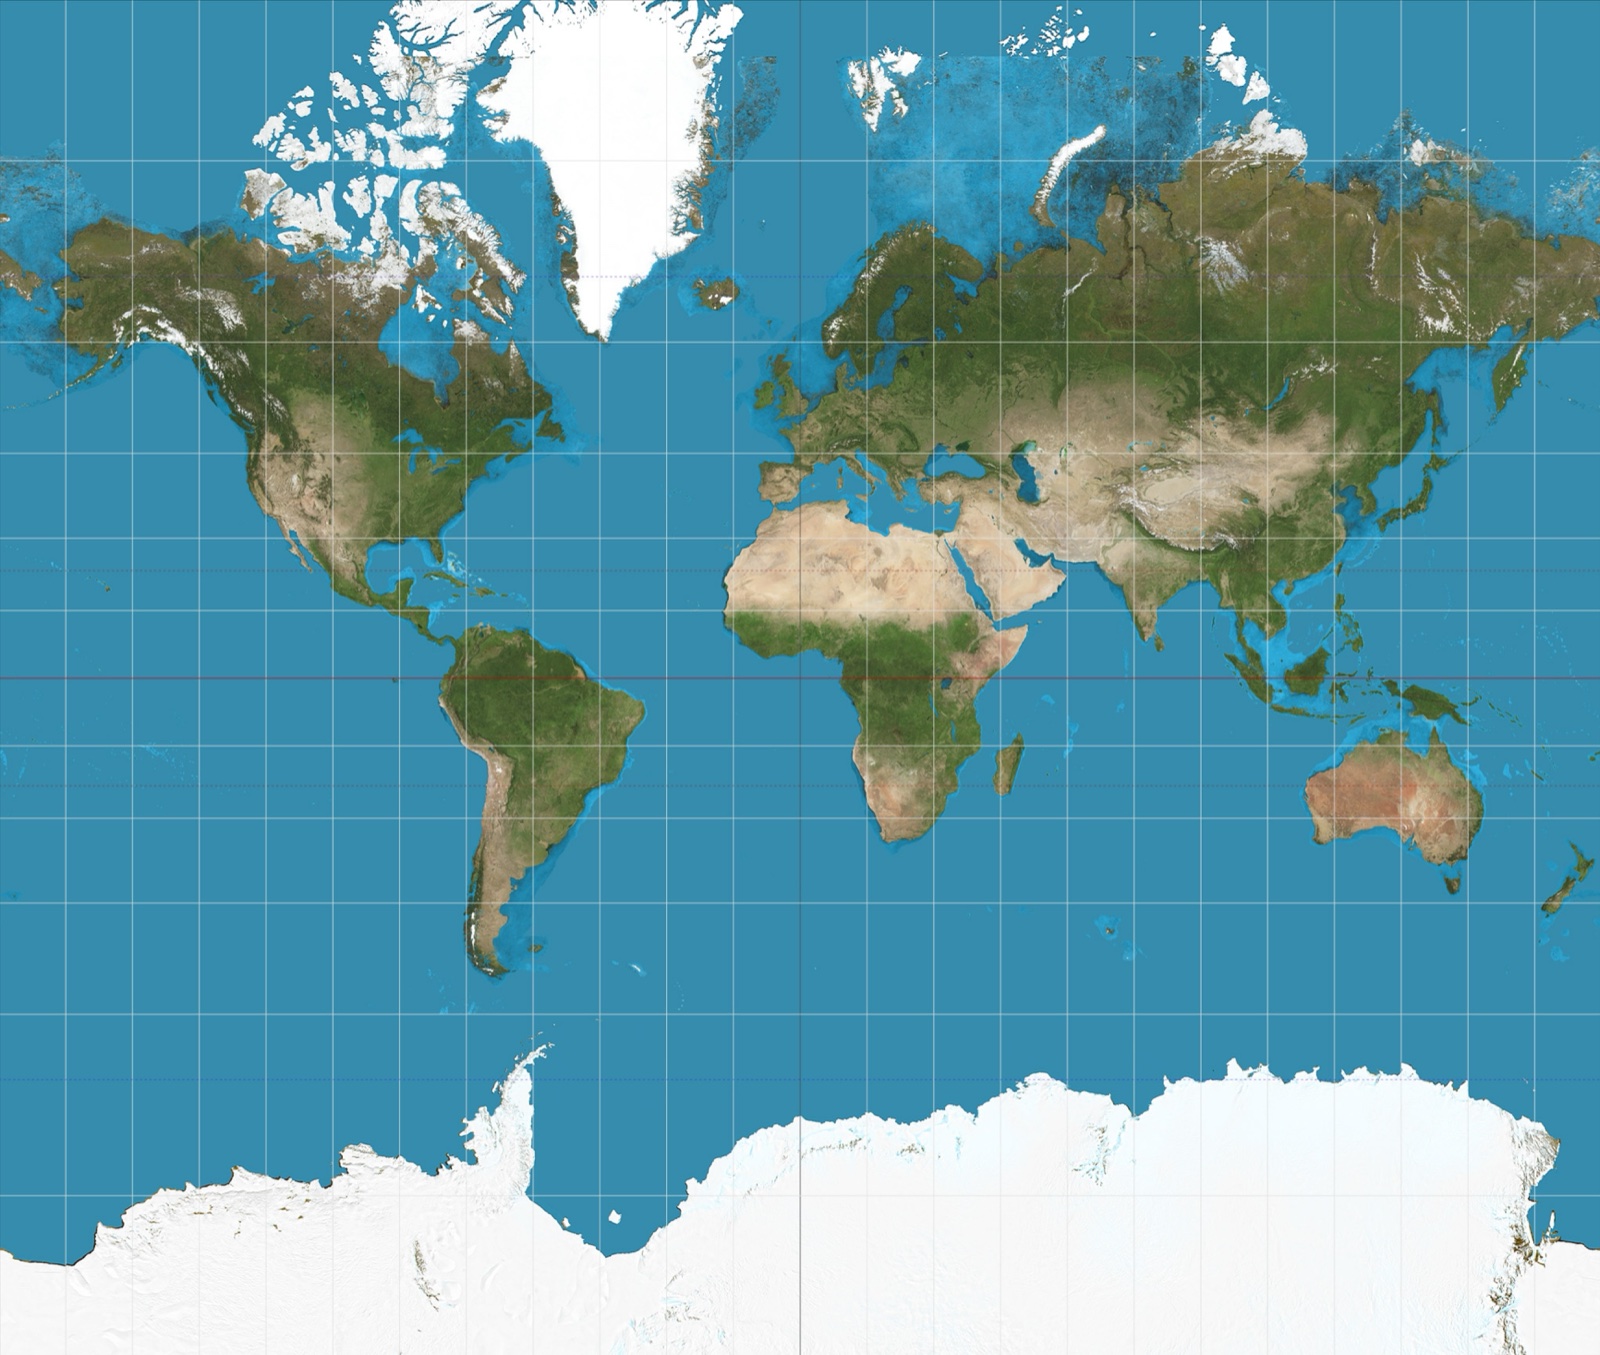
Greenland looks bigger than Africa on most maps. In reality, Africa is 14 times larger. You've been lied to your entire life — and the crazy part is, the mapmakers had no choice.
Here's the problem. Earth is a sphere. A map is flat. And there is no way — mathematically, physically, in any universe — to flatten a sphere perfectly without tearing, stretching, or squishing something. This isn't a technology problem we haven't solved yet. It's a geometry problem that has no solution. Every single map you've ever looked at is a compromise. The question is just: what did this map decide to sacrifice?
Cartographers call their flattening methods 'projections' — as in, mathematically projecting the curved surface onto a flat plane. Every projection preserves some things accurately while distorting others. You can't have it all. So every map is secretly a set of choices about what matters and what gets sacrificed. Shape. Size. Distance. Direction. Pick your poison.
Make your call
Before we get into how the Mercator projection works: why do you think Greenland appears almost as large as Africa on most classroom maps? Take a guess.
A
Mercator made a measurement error when originally surveying the northern latitudes
B
Mercator stretched regions near the poles to preserve accurate compass directions, inflating their apparent size
C
Greenland is drawn at a larger scale because Arctic routes were more important to European explorers
Example
The map you've seen your whole life — in classrooms, on Wikipedia, probably on your wall — is almost certainly the Mercator projection. A Flemish cartographer named Gerardus Mercator made it in 1569. His goal was practical: draw a map where sailors could plot a straight line and follow it as a compass bearing without adjusting. It worked brilliantly for navigation. But to make direction accurate, Mercator had to stretch things near the poles. The further from the equator, the more bloated everything gets. That's why Greenland looks the size of Africa. That's why Alaska looks bigger than Mexico. Neither is true. Africa is 14x bigger than Greenland. Mexico is larger than Alaska. The Mercator projection just never needed to get that right — it was built for ships, not for understanding the relative size of continents.
Key Insight
Every map projection preserves some properties and distorts others. There is no exception. A map that gets shape right distorts size. A map that gets size right distorts shape. A map that gets distance right distorts both. This is not a flaw in our technology. It is a mathematical law. Choosing a map is choosing what truth you care about most.
So what are the options? Cartographers have invented hundreds of projections, each with a different trade-off. The Gall-Peters projection makes every country's area accurate, so Africa finally looks as massive as it actually is, but countries get weirdly stretched vertically, like someone grabbed the continents and pulled. The Winkel Tripel projection (the one National Geographic uses) tries to minimize all distortions at once, so nothing is perfectly accurate but nothing is embarrassingly wrong either. It's the diplomatic compromise of maps. And then there's the AuthaGraph, a Japanese projection from 1999 that folds the globe into a rectangle with almost no distortion anywhere — and it looks so unfamiliar that most people assume it's broken.
Key Insight
The map you grew up with wasn't chosen because it's the most accurate. It was chosen because it was useful for European sailors in the 1500s — and then it just... stuck. Remember the hook: the mapmakers had no choice about distortion — but they did have a choice about which distortion to keep. The maps we use shape how we think about the world. Countries that appear large feel powerful. Countries that appear small feel peripheral. That's not neutral. That's a political choice baked into geometry.
Sources
Images from Wikimedia Commons. Attribution required by license.
The world on Mercator projection between 82°S and 82°N. 15° graticule. Imagery is a derivative of NASA’s Blue Marble summer month composite with oceans lightened to enhance legibility and contrast. Image created with the Geocart map projection software.
Strebe · CC BY-SA 3.0
This spectacular “blue marble” image is the most detailed true-color image of the entire Earth to date. Using a collection of satellite-based observations, scientists and visualizers stitched together months of observations of the land surface, oceans, sea ice, and clouds into a seamless, true-color mosaic of every square kilometer (.386 square mile) of our planet. These images are freely available to educators, scientists, museums, and the public.
Much of the information contained in this image came from a single remote-sensing device-NASA’s Moderate Resolution Imaging Spectroradiometer, or MODIS. Flying over 700 km above the Earth onboard the Terra satellite, MODIS provides an integrated tool for observing a variety of terrestrial, oceanic, and atmospheric features of the Earth. The land and coastal ocean portions of these images are based on surface observations collected from June through September 2001 and combined, or composited, every eight days to compensate for clouds that might block the sensor’s view of the surface on any single day.
Two different types of ocean data were used in these images: shallow water true color data, and global ocean color (or chlorophyll) data. Topographic shading is based on the GTOPO 30 elevation dataset compiled by the U.S. Geological Survey’s EROS Data Center. MODIS observations of polar sea ice were combined with observations of Antarctica made by the National Oceanic and Atmospheric Administration’s AVHRR sensor—the Advanced Very High Resolution Radiometer. The cloud image is a composite of two days of imagery collected in visible light wavelengths and a third day of thermal infra-red imagery over the poles. Global city lights, derived from 9 months of observations from the Defense Meteorological Satellite Program, are superimposed on a darkened land surface map.
NASA’s Terra satellite for the MODIS imageries, combined by Meow. Credit: NASA Goddard Space Flight Center Image by Reto Stöckli (land surface, shallow water, clouds). Enhancements by Robert Simmon (ocean color, compositing, 3D globes, animation). Data and technical support: MODIS Land Group; MODIS Science Data Support Team; MODIS Atmosphere Group; MODIS Ocean Group Additional data: USGS EROS Data Center (topography); USGS Terrestrial Remote Sensing Flagstaff Field Center (Antarctica); Defense Meteorological Satellite Program (city lights). · Public domain
Map of the world in a Gall–Peters cylindrical equal-area projection also known as Gall's orthographic or Peters, with Tissot's Indicatrices of deformation.Each red ellipse has a radius of 500 km.
Eric Gaba (Sting · fr:Sting)
Quiz yourself